How Business Intelligence Helps Businesses Make Better Data-Driven Decisions
Businesses generate enormous amounts of information every day.
Sales transactions, customer interactions, website visits, inventory movements, financial records, employee performance and operational activity all produce data. Yet having large amounts of data does not automatically make a business more informed.
The real challenge is turning raw information into useful insight.
This is where business intelligence (BI) comes in.
Business intelligence refers to the technologies, processes and analytical methods businesses use to collect, organize, analyze and present information so decision-makers can understand what is happening and make more informed choices.
Instead of relying entirely on intuition, assumptions or scattered spreadsheets, organizations can use BI to build decisions around evidence.
Business intelligence is also an important capability within the broader technology environment that supports modern organizations. The Complete Guide to Business Software provides broader context on how business applications and technology systems work together to support organizational operations.
For businesses building modern technology environments, BI also depends on reliable data, databases, infrastructure, analytics platforms and cloud services. Understanding that broader environment starts with Cloud Computing Explained.
What Is Business Intelligence?
Business intelligence is a broad category of tools and practices designed to help organizations understand their data.
A typical BI environment can bring information together from multiple sources, including:
-
Sales systems
-
Accounting software
-
Customer relationship management platforms
-
Websites
-
E-commerce platforms
-
Inventory systems
-
Marketing platforms
-
Human resources systems
-
Supply-chain applications
The information can then be processed and presented through reports, dashboards, charts and analytical tools.
A manager might use a dashboard to see today’s sales, compare revenue with the previous month and identify which products are performing best.
A finance team might analyze expenses and cash flow.
A marketing team might examine customer acquisition costs and campaign performance.
The technology is different across organizations, but the underlying goal is the same: turn business data into information that supports better decisions.
Why Data Alone Is Not Enough
Raw data can be difficult to interpret.
Imagine an online retailer has millions of transaction records. The data might contain product IDs, prices, customer locations, timestamps, payment methods and order statuses.
Looking at individual records does not necessarily tell management what is happening.
BI tools can aggregate those records and reveal patterns.
For example, the company might discover that:
-
Sales are growing rapidly in one region.
-
A particular product has declining demand.
-
Mobile customers have a higher conversion rate.
-
Certain products are frequently purchased together.
-
Returns are increasing for a particular category.
-
Weekend sales significantly exceed weekday sales.
Those observations are more useful for decision-making than the underlying transactions alone.
BI Turns Questions Into Measurable Answers
Business leaders constantly face questions.
How much are we selling?
Which products are most profitable?
Where are customers coming from?
Why did revenue fall last quarter?
Which marketing campaigns are working?
Are operating costs increasing?
Where are customers abandoning the buying process?
BI systems can help answer these questions by connecting business objectives with measurable data.
The result is a shift from simply asking “What do we think is happening?” to asking “What does the evidence show?”
Dashboards Make Complex Information Easier to Understand
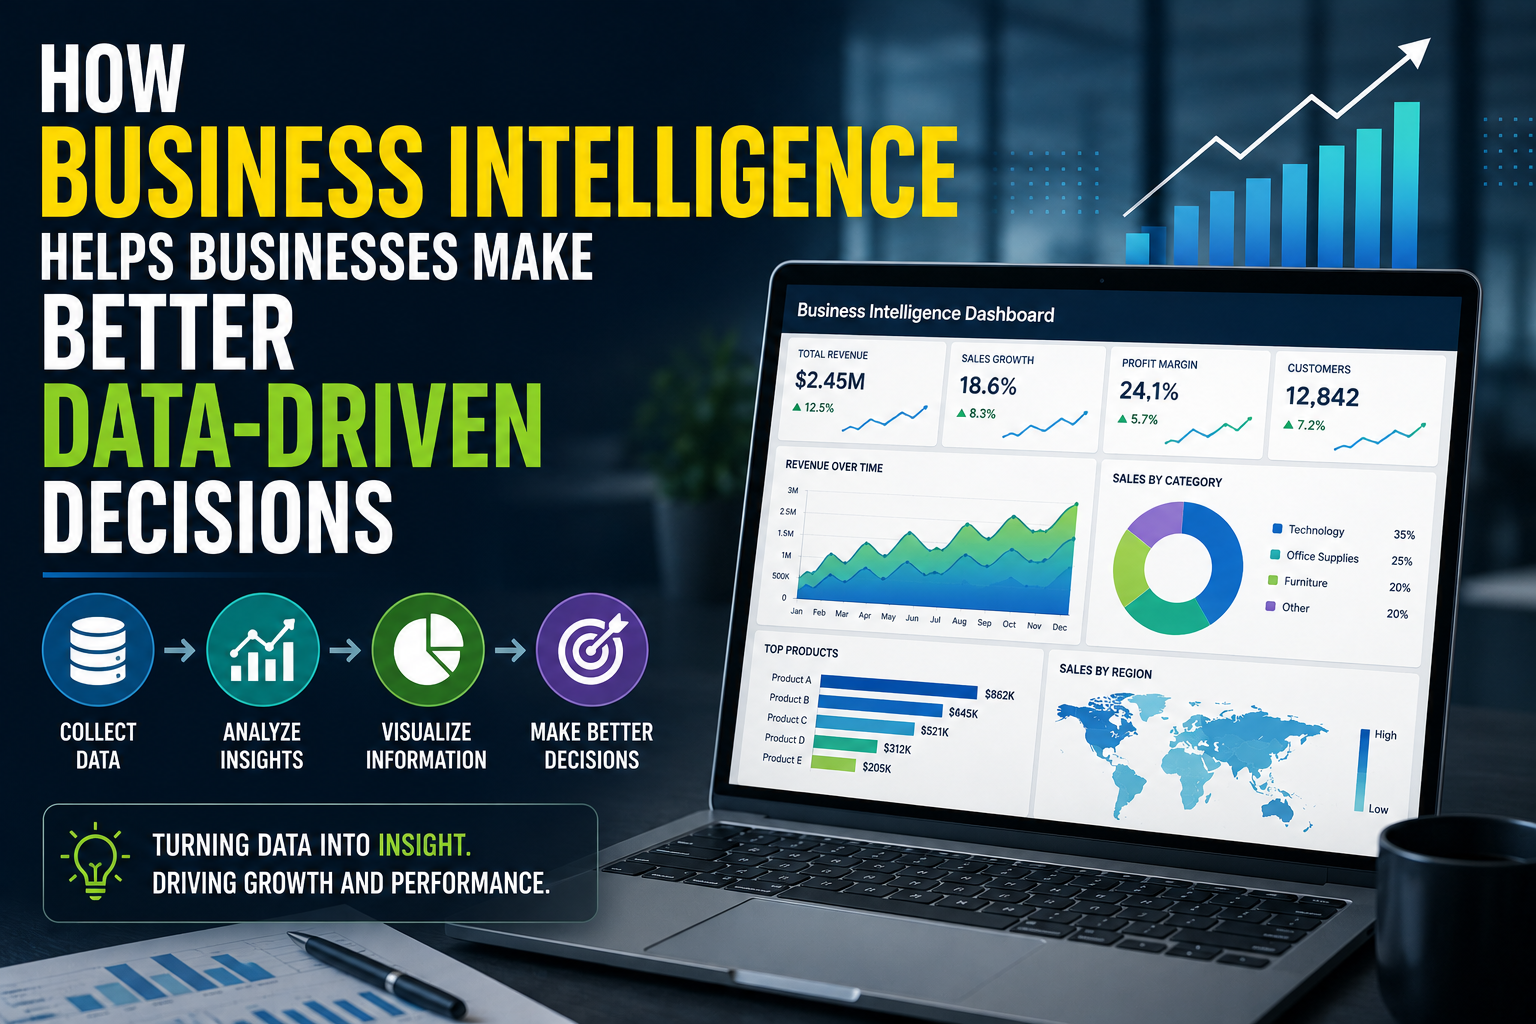
One of the most recognizable features of business intelligence is the dashboard.
A dashboard presents selected metrics in a visual format that allows users to understand important information quickly.
A sales dashboard might display:
-
Revenue
-
Number of orders
-
Average order value
-
Sales by region
-
Sales by product
-
Sales growth
-
Sales targets
Instead of opening multiple spreadsheets and manually calculating figures, a manager can view the most important indicators in one place.
Good dashboards are not simply collections of colorful charts.
They are designed around specific business questions.
Key Performance Indicators Give Businesses Focus
Business intelligence often revolves around key performance indicators (KPIs).
KPIs are measurable indicators used to evaluate performance against important objectives.
Different businesses will use different KPIs.
A retailer might track:
-
Revenue
-
Gross margin
-
Average order value
-
Customer retention
-
Inventory turnover
A software company might monitor:
-
Monthly recurring revenue
-
Customer acquisition cost
-
Churn
-
User growth
-
Lifetime customer value
A logistics company might track:
-
Delivery time
-
Fuel costs
-
Vehicle utilization
-
On-time delivery rate
The important point is that BI helps organizations connect these measurements to broader business goals.
Historical Data Helps Businesses Understand Trends
One of the simplest ways BI creates value is by making historical comparisons easier.
A business can compare current performance with:
-
Last week
-
Last month
-
Last quarter
-
Last year
-
A previous business cycle
-
A specific target
This makes it easier to distinguish between temporary changes and longer-term trends.
For example, a retailer might notice that sales have fallen by 10% compared with the previous month.
That sounds concerning.
But if the same month typically experiences a seasonal decline, the situation may be less alarming.
Historical data provides context.
Real-Time Data Can Support Faster Decisions
Some BI systems can provide information with very little delay.
This can be valuable when business conditions change quickly.
A logistics company could monitor deliveries as they happen.
An online retailer could track orders during a major promotion.
A manufacturing operation could monitor production metrics.
A financial team could observe cash positions throughout the day.
Real-time or near-real-time information does not automatically produce better decisions, but it can reduce the delay between something happening and management becoming aware of it.
BI Helps Identify Problems Earlier
Businesses often discover problems only after they have become significant.
A traditional monthly report might reveal that sales have been declining for several months.
A BI dashboard could potentially reveal the decline much earlier.
For example, management might notice:
-
Falling website conversions
-
Increasing customer complaints
-
Rising return rates
-
Slower delivery times
-
Increasing employee turnover
-
Declining inventory availability
Early visibility gives organizations more time to investigate and respond.
The objective is not to eliminate every problem.
It is to avoid being surprised by problems that the available data could have revealed earlier.
Business Intelligence Improves Financial Decision-Making
Financial decisions are among the most important areas where BI can help.
Businesses need to understand where money is coming from and where it is going.
BI systems can bring together financial information to help management analyze:
-
Revenue
-
Expenses
-
Profit margins
-
Cash flow
-
Accounts receivable
-
Accounts payable
-
Budget performance
-
Departmental spending
Instead of waiting for a long report at the end of a period, decision-makers can potentially monitor financial performance throughout the business cycle.
BI Can Reveal Which Products Are Actually Profitable
High sales do not necessarily mean high profitability.
A product can generate substantial revenue while producing relatively little profit because of manufacturing, shipping, marketing or other costs.
BI can combine sales and cost information to provide a clearer picture of product profitability.
Management might discover that:
-
Product A generates the most revenue.
-
Product B has the highest profit margin.
-
Product C sells well but has high return costs.
-
Product D has low sales but unusually strong profitability.
Those insights can influence pricing, inventory and marketing decisions.
Customer Analytics Makes Consumer Behavior More Visible
Customers leave behind enormous amounts of data.
Businesses can analyze customer information to understand:
-
What people buy
-
How frequently they buy
-
Which channels they use
-
How much they spend
-
Where they abandon purchases
-
Which products they prefer
-
How long they remain customers
This can help organizations develop more targeted strategies.
For example, a company might discover that customers acquired through one marketing channel spend significantly more over their lifetime than customers acquired through another.
That information could influence future marketing investment.
The quality of these insights also depends on how organizations collect, organize, maintain and govern their information. A strong business data management strategy can help ensure that the information feeding BI systems remains useful and consistent.
BI Supports Better Marketing Decisions
Marketing can involve significant spending, and businesses want to know whether those investments are producing results.
Business intelligence can combine information from different marketing channels to help organizations evaluate performance.
A marketing dashboard might compare:
-
Advertising spending
-
Website traffic
-
Leads
-
Conversions
-
Customer acquisition cost
-
Revenue
-
Return on advertising spend
This can make it easier to identify which campaigns are generating meaningful business results.
Rather than simply asking which campaign received the most clicks, a company can investigate which campaigns ultimately generated valuable customers.
Sales Teams Can Use BI to Improve Performance
Sales organizations can use BI to analyze their pipelines and customer activity.
Managers can examine:
-
Number of leads
-
Conversion rates
-
Average deal size
-
Sales cycle length
-
Revenue by salesperson
-
Revenue by region
-
Pipeline value
-
Win rates
These metrics can reveal bottlenecks.
If many opportunities enter the sales pipeline but few reach the final stage, the business may need to investigate pricing, product fit, sales processes or customer objections.
Inventory Management Becomes More Predictable
Inventory problems can be expensive.
Too much inventory ties up capital and increases storage costs.
Too little inventory can lead to stockouts, missed sales and frustrated customers.
BI can help businesses analyze historical demand, sales patterns and inventory levels.
A retailer might identify products that consistently sell faster during particular periods.
That information can support purchasing decisions and reduce the likelihood of either excessive stock or shortages.
Supply Chains Can Benefit From Better Visibility
Modern supply chains involve many interconnected activities.
A delay at one point can affect the entire operation.
BI can combine information about suppliers, transportation, inventory and demand to give businesses a broader view of their supply chains.
Managers can potentially identify:
-
Supplier performance problems
-
Transportation delays
-
Inventory bottlenecks
-
Increasing logistics costs
-
Demand changes
-
Geographic problem areas
This can make it easier to respond before disruptions become major operational problems.
BI Helps Businesses Compare Performance Across Locations
Businesses with multiple branches or markets can use BI to compare performance.
A company might operate stores in several cities and want to understand why some locations outperform others.
A BI system could compare:
-
Revenue
-
Customer volume
-
Average transaction value
-
Labor costs
-
Operating expenses
-
Inventory turnover
-
Profit margins
The goal is not necessarily to rank locations simply from best to worst.
Differences can provide clues about what is working and where improvements may be possible.
Data Visualization Makes Patterns Easier to See
Humans often recognize patterns more quickly through visual information than through large tables of numbers.
Charts and graphs can make trends more apparent.
A line chart might show revenue increasing steadily.
A bar chart could reveal a large difference between regional sales.
A heat map might identify geographic concentrations of customers.
A well-designed visualization can turn a complicated dataset into a pattern that decision-makers can understand quickly.
However, visualization must be used carefully.
A misleading chart can produce a misleading conclusion.
Self-Service BI Gives More Employees Access to Data
Traditional reporting often requires employees to ask an IT or analytics team for every report.
That can create delays.
Self-service business intelligence allows authorized employees to explore data and create their own reports and dashboards without depending entirely on technical specialists.
A sales manager, for example, could build a report comparing regional performance.
A marketing manager could examine campaign results.
A finance manager could analyze spending.
Self-service tools can make data analysis more accessible across an organization.
Data Quality Is Critical
BI systems are only as useful as the information they analyze.
If the underlying data is inaccurate, incomplete or inconsistent, the resulting insights can be misleading.
Common data-quality problems include:
-
Duplicate records
-
Missing values
-
Incorrect entries
-
Different naming conventions
-
Outdated information
-
Inconsistent definitions
For example, two departments might calculate “active customer” differently.
One department might define an active customer as someone who purchased within 30 days, while another uses a 90-day period.
If those definitions are not reconciled, management could receive conflicting reports.
The underlying information may also be stored across different database systems. Understanding how databases work and how they organize information can therefore be valuable when designing reliable BI environments.
Businesses evaluating the software layer that manages these databases can also explore the complete guide to database software to understand how database management systems support the applications and data environments behind BI.
Data Governance Creates Trust
Data governance refers to the policies, responsibilities and processes used to manage organizational data.
Good governance can establish:
-
Who owns particular datasets
-
Who can access information
-
How data is defined
-
How quality is maintained
-
How sensitive information is protected
-
How data is stored and retained
This matters because employees need to trust the numbers they use to make decisions.
If different dashboards produce different answers to the same question, confidence in the BI system can quickly disappear.
Organizations also need clear technology responsibilities and decision-making processes when managing BI platforms and other technology systems. The guide to IT governance and technology decision-making explains how governance can establish accountability, oversight, and risk management around technology.
Security Is an Essential Part of BI
Business intelligence platforms often contain sensitive information.
That information may include customer details, financial data, employee records or confidential business performance.
Organizations therefore need appropriate security controls.
These can include:
-
User authentication
-
Role-based access
-
Encryption
-
Activity monitoring
-
Secure data connections
-
Access auditing
Employees should generally have access only to the information they need to perform their responsibilities.
Predictive Analytics Takes BI Further
Traditional BI focuses heavily on understanding what has already happened.
Predictive analytics attempts to estimate what could happen next.
Businesses can use historical data and statistical or machine-learning techniques to identify patterns that may help forecast future outcomes.
Examples include:
-
Predicting customer churn
-
Forecasting demand
-
Estimating future sales
-
Predicting inventory requirements
-
Identifying potential fraud
-
Forecasting staffing needs
Predictions are not guarantees.
They depend on the quality of the underlying data and the assumptions built into the models.
Nevertheless, they can provide another useful input for decision-making.
For organizations looking to understand the broader analytical process behind these capabilities, the complete guide to data analytics for business provides a useful related perspective.
Prescriptive Analytics Can Suggest Actions
Some advanced analytics systems go beyond prediction.
Prescriptive analytics attempts to identify potential actions based on predicted outcomes and business constraints.
For example, a system might evaluate different inventory strategies and estimate their likely impact on costs and stock availability.
The technology can help decision-makers compare scenarios rather than simply observe historical data.
Human judgment remains important because business decisions often involve factors that are difficult to capture numerically.
BI Helps With Scenario Planning
Business leaders frequently have to prepare for uncertainty.
What happens if demand increases by 20%?
What if supplier costs rise?
What if the company opens another location?
What if advertising spending is reduced?
BI and analytics tools can help organizations model different scenarios.
Scenario analysis does not predict the future with certainty.
Instead, it allows decision-makers to understand how different assumptions could affect business outcomes.
That can make planning more deliberate.
Business Intelligence Does Not Replace Human Judgment
One of the biggest misconceptions about data-driven decision-making is that data eliminates the need for human judgment.
It does not.
Data can reveal patterns, but people still need to interpret those patterns.
A sales decline might be caused by pricing, competition, product availability or an external event.
A dashboard may show the problem, but management still needs to investigate the cause and determine what response makes sense.
Good decision-making combines evidence with experience, context and judgment.
Avoiding the Trap of Too Much Data
More information is not always better.
Businesses can create hundreds of dashboards and thousands of metrics while still failing to understand what matters.
This can produce analysis paralysis.
A useful BI strategy begins with business questions.
Instead of asking:
“What data can we collect?”
A better question is:
“What decisions do we need to make, and what information would improve those decisions?”
That approach helps organizations focus on meaningful metrics instead of collecting data simply because it is available.
BI Can Create a Common View of the Business
One of the most valuable benefits of BI is creating a shared understanding across departments.
Without centralized reporting, different teams may work from different spreadsheets and definitions.
Sales might report one revenue figure while finance reports another.
Marketing may use a different customer count from the customer-service department.
A well-governed BI environment can establish common definitions and shared reporting.
This creates a more consistent view of business performance.
Data-Driven Culture Matters as Much as Technology
Buying BI software does not automatically create a data-driven organization.
Employees need to understand how to interpret information and incorporate it into their work.
Leaders also need to demonstrate that evidence matters.
If executives consistently make decisions based on unsupported assumptions despite having reliable data available, employees are unlikely to change their own behavior.
A genuine data-driven culture requires:
-
Leadership support
-
Employee training
-
Reliable data
-
Clear metrics
-
Accessible tools
-
Good governance
-
Willingness to challenge assumptions
Technology provides the infrastructure, but people determine how effectively it is used.
The Future of Business Intelligence
Business intelligence is evolving as artificial intelligence becomes more deeply integrated into analytics platforms.
Instead of manually building every report, users may increasingly ask questions in natural language.
For example:
“Why did revenue decline last month?”
An AI-powered analytics system could potentially analyze sales, pricing, customer behavior, inventory and regional performance to identify relevant factors.
Other systems may automatically detect unusual changes and alert managers before they notice them manually.
The long-term direction is toward analytics that are more conversational, automated and proactive.
Turning Numbers Into Better Business Choices
Business intelligence does not make decisions for a company.
Its value comes from making the information behind those decisions easier to access, understand and act upon.
A business can use BI to identify trends, uncover inefficiencies, understand customers, monitor finances, improve forecasting and respond to changing conditions.
The strongest systems do more than display impressive dashboards. They connect reliable data to important business questions and give decision-makers the context they need to act.
As organizations continue generating more information, the competitive advantage may not belong simply to businesses with the most data.
It may belong to those that can turn their data into clear insight—and turn that insight into better decisions faster.